Combine data from several sheets or files (and stop copy-pasting every month)
To combine files with the same columns, save them in one folder and use Data › Get Data › From File › From Folder › Combine › Combine & Transform Data. For sheets in the same workbook, use Append Queries in Power Query or, in Microsoft 365, the formula =VSTACK(SalesJan,SalesFeb). Each month, Refresh All adds what's new.
It happens every month: each branch sends you its sales workbook, or you keep one sheet per month, and to build the report you open them one by one, copy, paste underneath, check you didn't skip a row… and hope you didn't paste the same file twice.
Excel has tools to stack data: place the rows of several tables one under another in a single table. Picture an inbox: you drop the files into a folder and Excel collects them all, in order, whenever you ask. The main tool is Power Query, built into Excel since version 2016.
In this guide you learn three routes: combining every file in a folder, combining several sheets of one workbook and, if you have Microsoft 365, doing it with a single formula. At the end you'll see Consolidate, the classic option, and when it makes sense.
What you'll learn
- How to combine every file in a folder with Power Query
- How to tell which file each row came from
- How to combine sheets in the same workbook with Append Queries
- How to stack tables with the VSTACK formula in Microsoft 365
- When to use Consolidate and when not to
Step by step
Prepare the files: same columns and a folder of their own
Power Query combines things that look alike. Before you start, check that every file has the same columns with the same names (for example, Date, Branch, Product, Amount) and, if possible, the data in a table with the same name in each file (for example, Sales).
Create a folder just for them, such as Sales 2026. Any file that lands there will be combined, so don't store anything else in it.

Open “Get Data › From File › From Folder”
In a new workbook (the one that will be your report), go to Data › Get Data › From File › From Folder. Browse to the Sales 2026 folder and click Open.
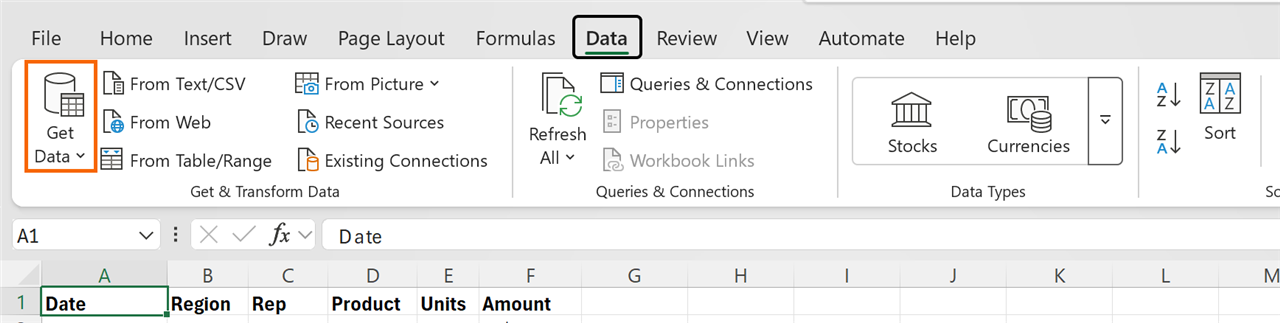
Depending on your version, the option may be labeled slightly differently. In older versions a small extra window asks you to confirm the folder path: just click OK.
Check the file list and click “Combine & Transform Data”
Power Query shows you the files it found. Check they're all there and that nothing unrelated slipped in. At the bottom, open Combine and choose Combine & Transform Data: that way you can review the result before loading it.

Choose which table or sheet to combine from each file
The Combine Files window opens. Leave Sample File on First file and, on the left, click the Sales table (or the sheet, if you don't use tables). Power Query will do the same with every file. Tick Skip files with errors if you don't want one broken file to stop the rest, and click OK.

Use “Source.Name” to see which file each row came from
In the editor you'll see all the rows stacked and a first column called Source.Name with the name of the source file. It's gold: double-click its header and call it Month. With the column selected, use Home › Replace Values to replace .xlsx with nothing.
Check the data types (date, decimal number) and click Home › Close & Load.
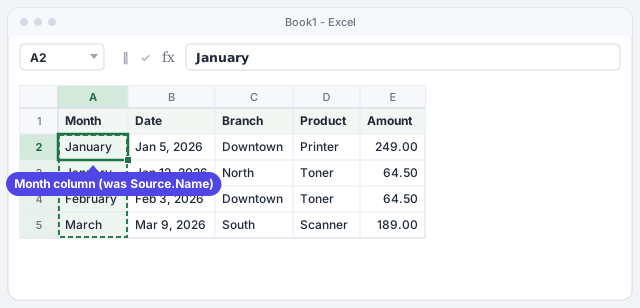
Power Query also creates some helper queries (Transform Sample File and others). Don't delete them: they're what processes each file.
Each month, drop the new file in the folder and refresh
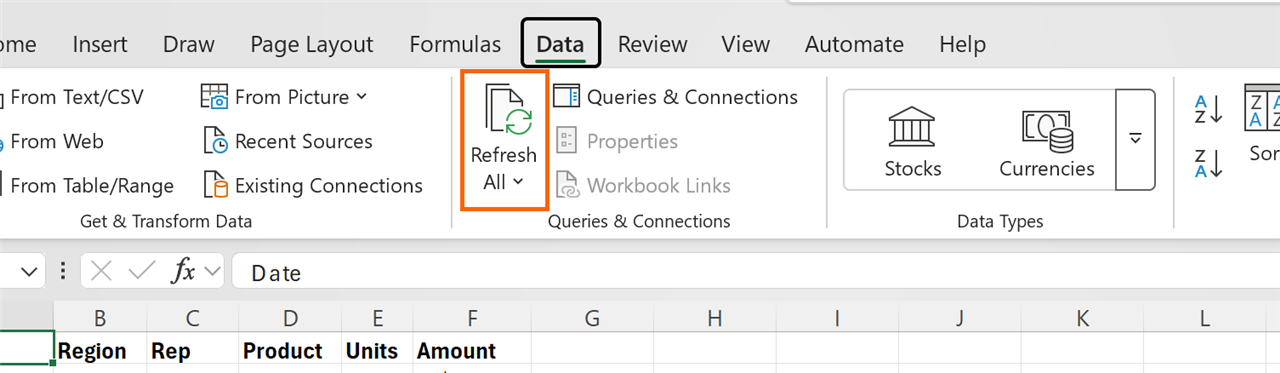
When April.xlsx arrives, save it in the Sales 2026 folder, open your report and go to Data › Queries & Connections › Refresh All. April's rows appear at the end of the table, with their month. If you have a PivotTable on top, Refresh All updates it too.
Combine sheets in the same workbook with “Append Queries”
If the data lives in several sheets of one workbook (January, February, March), turn each into a table and send it to Power Query with Data › From Table/Range. For each one, use Home › Close & Load To... and choose Only Create Connection so you don't duplicate data.
Then open any of them and go to Home › Combine › Append Queries › Append Queries as New. Choose Three or more tables, add the tables to the list on the right and click OK. Name the new query and click Close & Load.

With Microsoft 365, stack tables with a formula: VSTACK
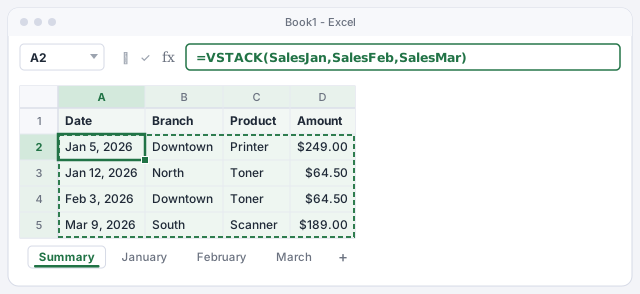
If you have Microsoft 365 or Excel 2024, the VSTACK function places several tables one under another and updates by itself when the data changes. Copy the headers into row 1 of a Summary sheet and type the formula in A2. Use Excel tables (here SalesJan, SalesFeb and SalesMar): they grow on their own and don't drag in empty rows.
To get it sorted by date, wrap it in SORT.
Stacks the rows of the three tables, without their headers.
Same thing, sorted by the first column (Date).
Meet “Consolidate”, the classic option
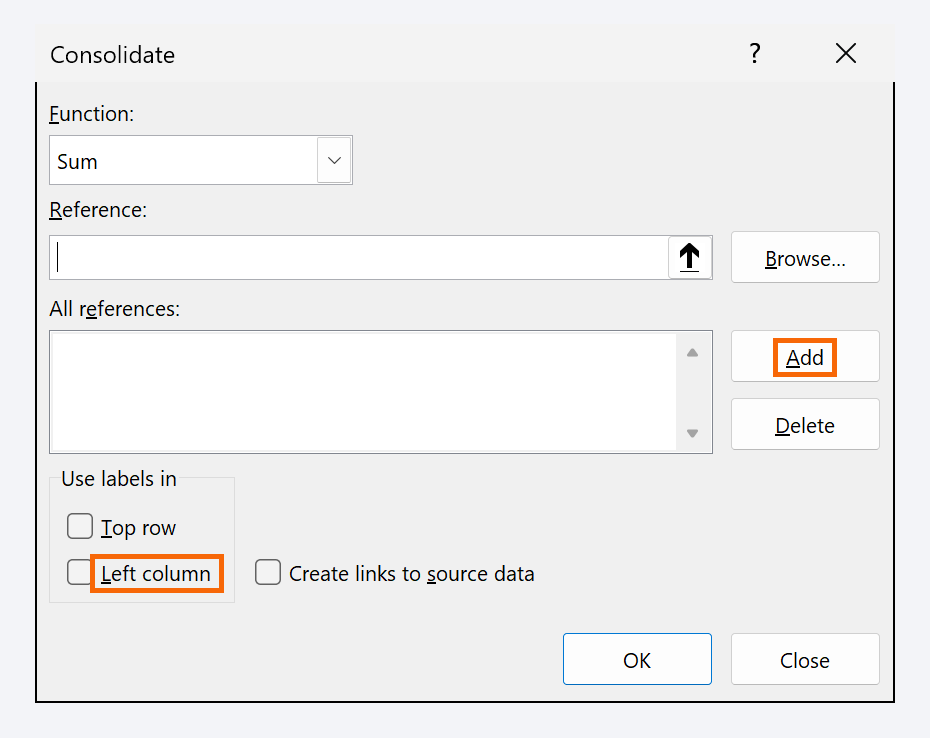
Data › Data Tools › Consolidate... exists in every version, but it doesn't stack rows: it summarizes. If each sheet has products in column A and amounts in column B, Consolidate adds up the amounts for each product. Pick the Function (for example, Sum), select each range in Reference, click Add and tick Top row and Left column so it groups by labels.
Use it for a quick total. For a full list that refreshes, Power Query or VSTACK are better.
Expert tips
- Strip totals from the source files. If each file ends with a “Total” row, it will be stacked as just another sale. Filter it out in Power Query or ask the branches for a template without totals.
- Hand out a template. If everyone fills in the same table with the same headers, the combine never breaks. A drop-down list for the branch avoids variants like “Downtown” and “downtown”.
- Files in OneDrive or SharePoint. If the folder is shared on SharePoint, use Get Data › From File › From SharePoint Folder: that way the report also works on any teammate's computer.
- Clean once, for all. Any steps you add to the combined query (trimming spaces, changing types) apply to every file, present and future. See Power Query: import and clean data.
Common mistakes and how to fix them
After refreshing, a new column full of blanks or shifted data appears.
One file has a different header (for example, “Amount $” instead of “Amount”). Fix the name in the source file and refresh again.
The data comes out duplicated.
There are two copies of the same file in the folder (for example, “March.xlsx” and “March (1).xlsx”), or the report itself is saved inside the folder. Keep only the source files there.
The formula =VSTACK(January!A2:D100,February!A2:D100) fills the summary with zeros.
Empty rows in the ranges show up as 0. Turn each sheet into a table and use the table names in the formula; they only include rows with data.
VSTACK returns #NAME?.
Your version doesn't have the function (it's in Microsoft 365 and Excel 2024). Use Power Query, which works from Excel 2016 on.
In Excel for Mac (Microsoft 365) the VSTACK function works the same and Power Query is under Data › Get Data, though with fewer sources than on Windows. If you don't see the folder option, build the query on Windows or use VSTACK.
Frequently asked questions
Can I combine CSV files instead of Excel workbooks?
Yes. From Folder works the same with CSV or text files, as long as they all have the same columns. In the Combine Files step you'll see a preview instead of the list of tables.
What happens if one month arrives with an extra column?
Power Query takes its columns from the sample file. An extra column in another file is ignored; a column with a different name may come out empty. The safest approach is for everyone to use the same template.
Does it update by itself when I add a file?
No: you need to click Refresh All or turn on Refresh data when opening the file in the query properties. VSTACK, on the other hand, recalculates by itself because it's a formula.
Should I use Power Query or VSTACK?
Use VSTACK for a few tables inside one workbook on Microsoft 365. Use Power Query for separate files, a folder that grows every month, or when the data needs cleaning on the way in.
Official sources
Microsoft documentation consulted for this guide.
Saved only in this browser.